Introduction
Wavefront is a two dimensional acoustic wave simulation application utilizing the TLM (transmission-line matrix) method.
It is designed to be a tool for educational purposes, allowing users to experiment with different acoustic scenarios and observe the effects of different parameters on the wave propagation.
It can be used to simulate point sound sources in a free field. A number of objects are provided to help shape the simulation for user specific tasks:
- Sources
- Rectangular and circular walls
- Microphones
Contributing
This project was developed by students of the University of Applied Sciences Cologne. If you would like to contribute to the project, open a pull request or issue on the GitHub repository.
License
Wavefront is licensed under the Apache License, Version 2.0. See LICENSE for more information.
Installation
Pre-compiled binaries
Executable binaries are available for download on the GitHub Releases page. Download the binary for your platform (Windows, macOS, or Linux) and extract the archive. The archive contains the wavefront executable.
Build from source using Rust
To build the wavefront executable from source, you will first need to install Rust and Cargo. Follow the instructions on the Rust installation page. Wavefront is built using Rust version 1.78.
Once Rust is installed, clone and enter the Github repository:
git clone https://github.com/AudioGroupCologne/wavefront.git
cd wavefront
Build wavefront in release mode using:
cargo run --release
Getting Started
The following page serves as a brief introduction to wavefront. Be sure to check out the rest of this user manual to understand this piece of software in its entirety.
Having either downloaded a pre-built binary or built wavefront from source, you are left with a wavefront binary. Wavefront does not require any further installation, as it is a portable software. Just double-click the executable to run the program.
You should be greeted by this window:
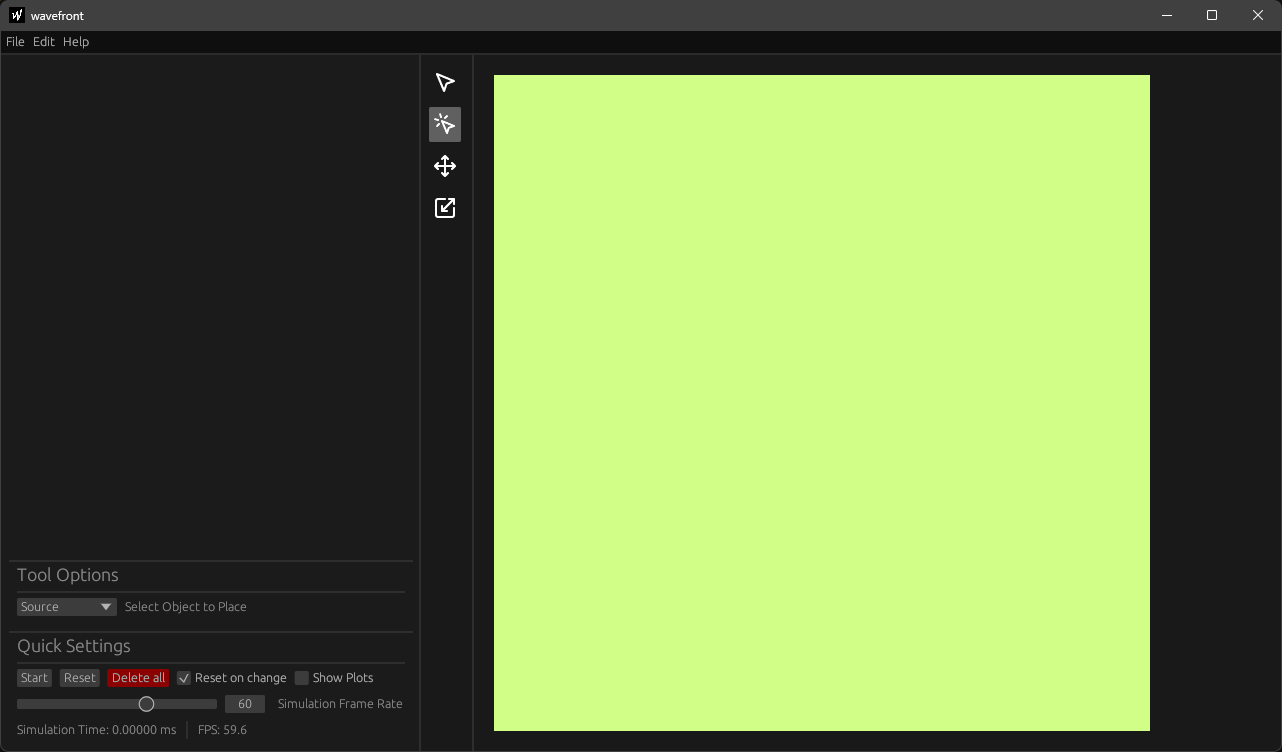
The default tool is the place tool  which allows you to place one of the following objects:
- Source
- Rectangular or circular wall
- Microphone
As shown in the tool option panel, Source is selected, meaning you'll be placing sources. Click on the render area to place a source. A new entry named Source 0 should appear in the outline panel.
Press space or click the Start button to run the simulation. Press space again to stop.
In the tool bar select the move tool  . This tool allows you move any object contained in the render area. If you feel like experimenting, try placing a wall and resizing it using the resize tool
  .
.
Currently, the simulation is reset every time you move or change an object. To disable this behavior, uncheck Reset on change in the quick settings menu.
All objects can be further customized in the outline panel.
While the render area displays the simulation, microphones give the user a more in-depth visualization of the simulation properties by displaying sound volume and frequency in the volume and frequency plots. After placing a microphone, enable the plots using the Show Plots checkbox.
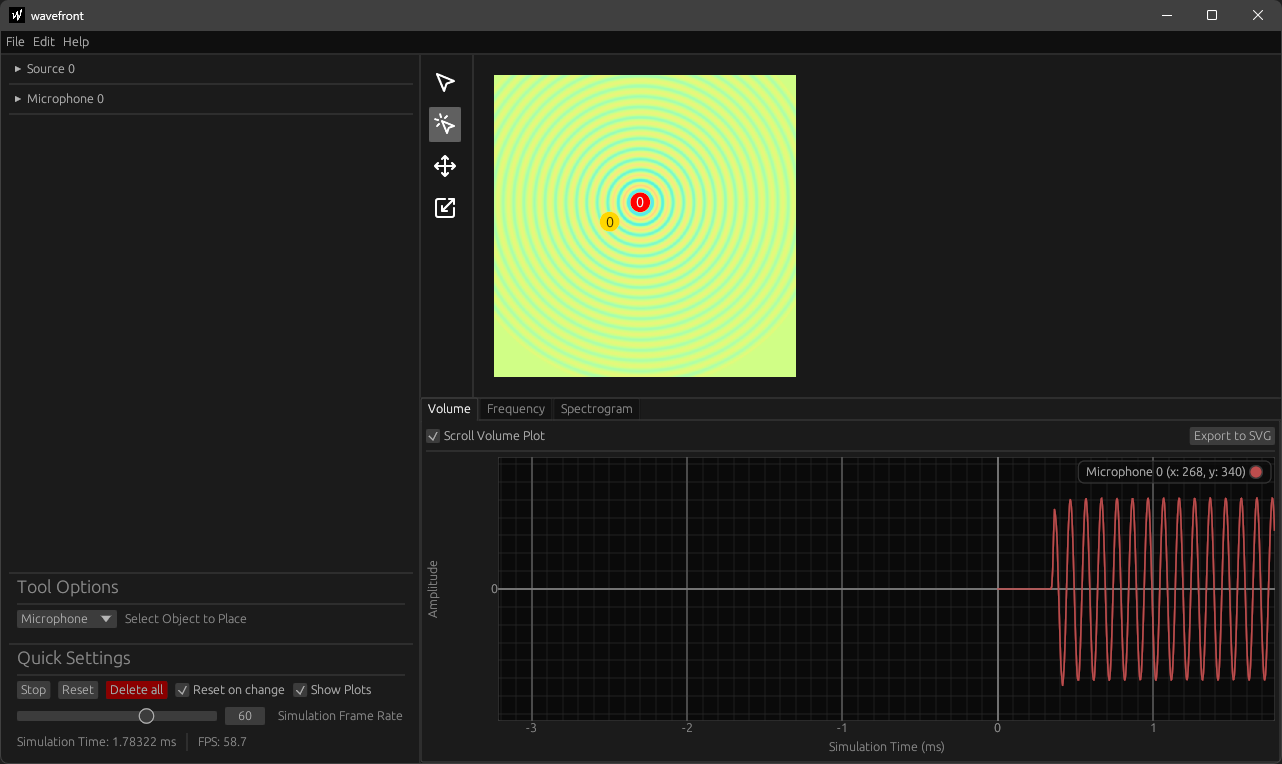
Also, check out our list of keybinds for more efficient use of wavefront.
Layout
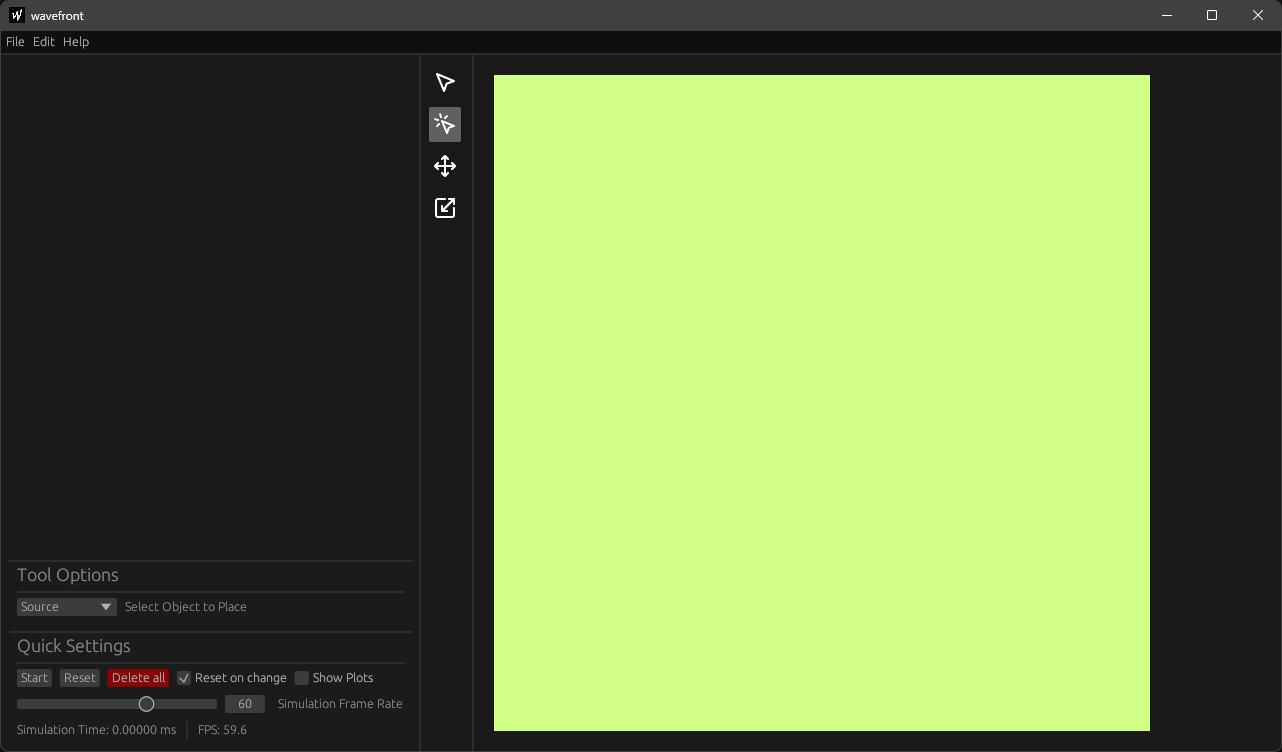
After starting wavefront, the opened window should look similar to the image below.
Wavefront's interface can be separated into seven main areas. Six of those areas are visible by default. The image below has them counted as well as color coded:
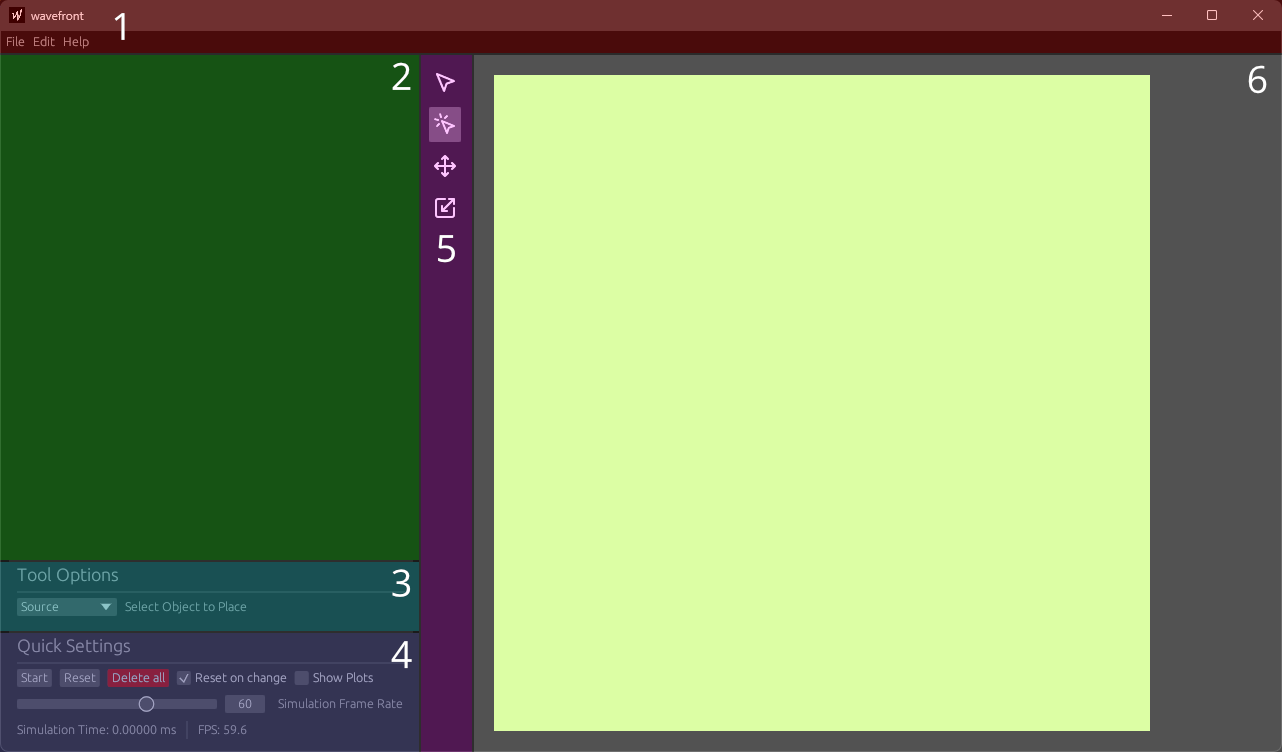
- Topbar (1 & red)
- The topbar at the very top is used to save, load and screenshot a simulation, as well as to access the preferences and keybinds.
- Outline (2 & green)
- The outline at the left lists all objects in the scene and offers more settings per object
- Tool Options (3 & lightblue)
- The tool settings at the bottom left are used to change tool specific settings
- Quick Settings (4 & lightpurple)
- The quick settings at the bottom left offer important settings for the overall simulation
- Toolbar (5 & purple)
- The toolbar in the middle is used to select the current tool
- Render Area (6 & white)
- The render area on the right displays the simulation in two dimensions
Plots
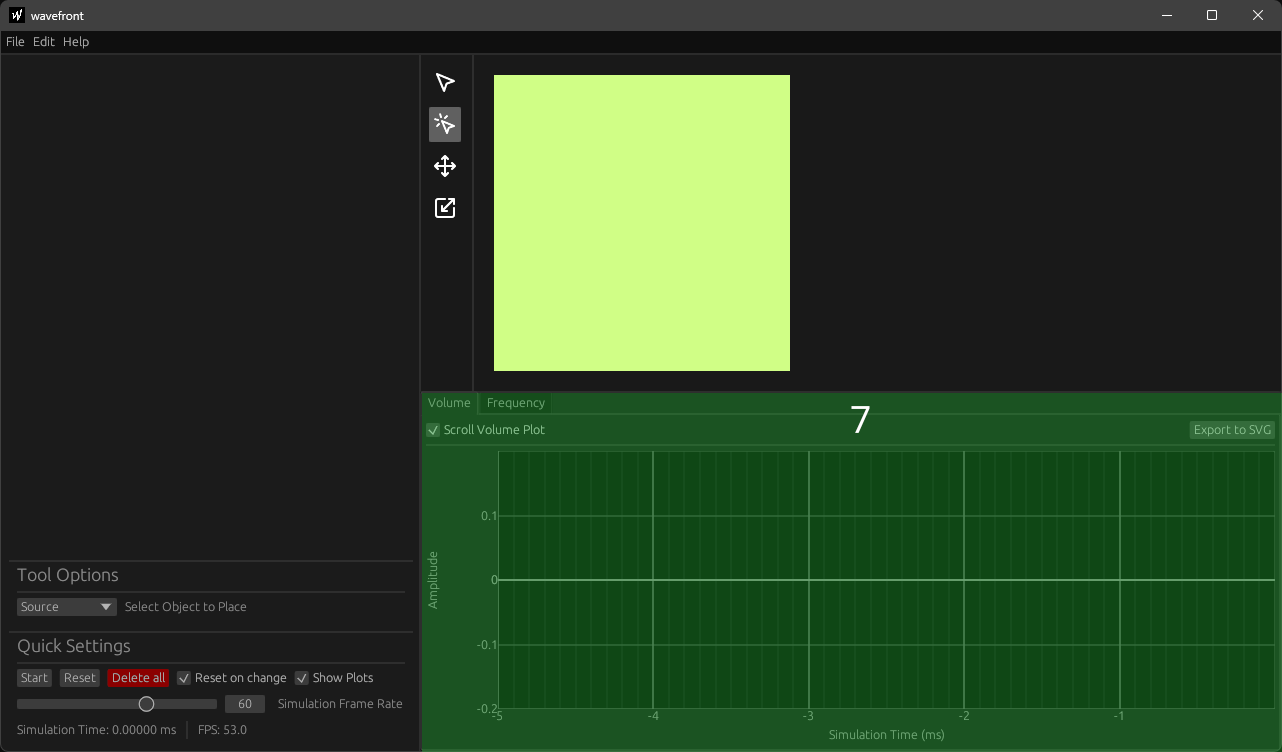
The plot panel (7 & green) can be accessed by enabling the Show Plots checkbox in the quick settings. Once clicked, another seventh ui area will open, as shown in the image below:
Render Area
The render area is the main area of the user interface where you can interact with the room and its objects. The render area is also where you can place, move, resize, and delete objects. The visual representation (the texture) of the render area scales with the size of the window. However, the underlying data (the simulation itself) is done in a 700x700 grid. Due to this, artifacts may appear at some resolutions.
Gizmos
Gizmos appear for each object, when you hover over the area. To get a better view of the simulation, you can hide the gizmos simply by hovering over a different area of the screen.
Gradients
Rendering happens each frame of the UI-Thread (VSynced to your monitor, usually 60Hz). The simulation is done at a variable rate, chosen by you (see Quick Settings). During rendering, all pressure values in each cell of the grid are used to look up a color in a gradient. The gradient can be changed in the Preferences.
Gamma Correction
The pixel buffer used (bevy_pixel_buffer) for rendering is storing pixel values in linear color space. This means that the colors are not gamma corrected. To correct this, a gamma correction is applied to the gradient colors using the gamma value 2.2.
Topbar
The topbar is a horizontal bar at the top of the screen that contains the following elements:
- File
- Edit
- Help
File Menu
Wavefront presents multiple options to manage simulations:
New
A new simulation can be created by clicking the New button or using the Ctrl+N keybind.
Save
A simulation can be saved by clicking the Save button or using the Ctrl+S keybind.
All objects with their respective settings as well as the overall color settings will be stored in a .json file.
Open
You can open a previously saved simulation using the Open button or by pressing Ctrl+O.
Screenshot
The screenshot function renders the current simulation as displayed in the render area into a .png file.
Quit
Quitting can be done here or using Ctrl+Q. But let's be real, quitting isn't really an option.
Edit Menu
Undo
Undoes all changes occurred in the last second.
Redo
Redoes undo steps in reverse order.
Preferences
Opens the preferences window.
Help Menu
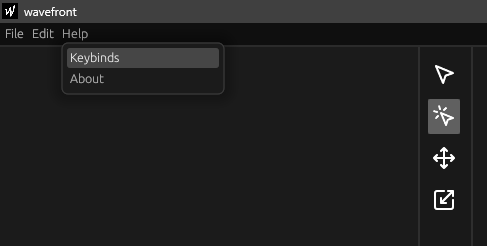
Keybinds
Opens the keybinds window.
About
Opens the about window.
Toolbar
The toolbar can be used to quickly change between tools that can be used to interact with the scene. For some tools, there are additional options that can be set in the tool options panel. For more information on the tools, see:
Sidebar
The sidebar panels are used for quickly changing simulation, object and tool settings. The sidebar is separated into the following panels:
Outline
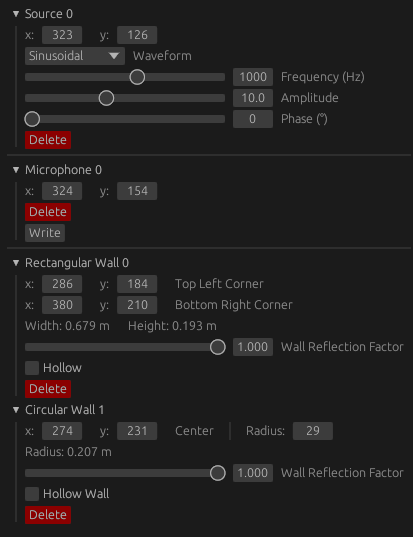
The outline panel is used for changing object settings. The objects are grouped into three groups:
- Sources
- Microphones
- Rectangular or circular walls
Highlight Features
When selecting an object in the render area using the select  or move
  tool, the selected object's entry in the outline panel will be expanded. All other entries will close.
When hovering over a closed entry in the outline panel, the corresponding object will be highlighted in the render area.
When expanding an entry in the outline panel, the corresponding object will be highlighted in the render area regardless of the cursor position.
Delete
The delete button allows for the deletion of an object This can be reverted using Ctrl + Z.
Object-Specific Settings
The parameters specific to each object are detailed on the respective object's page.
Tool Options
The tool options panel is used for customizing a tool's behavior.
No Tool Options
When a tool lacking configurable options is selected, the tool options panel will display an alert message. This is the case for all tools except for the place tool  .
.

Place Tool
The place tool will allow you to change the object type that is to be placed. A drop-down menu will display in order:
- Source
- Microphone
- Rectangle Wall
- Circular Wall

By default, Source will be selected. You can also use keybinds to change this setting.
When selecting either Rectangle Wall or Circular Wall the tool options panel will show the Wall reflection factor and Hollow settings.

Quick Settings
The quick settings panel offers frequently used simulation and program customization options, allowing for efficient configuration and adjustments.
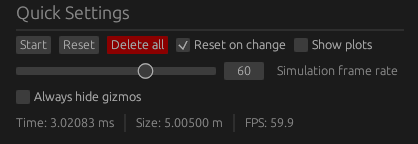
It is grouped into four rows:
The first row offers the Start/Stop button which is used to start or stop the simulation.
The Reset button resets the simulation area and time. The simulation does not pause after the reset.
The Delete All button deletes all simulation objects. It resets the simulation area, but not the simulation time.
The Reset on change checkbox configures the behavior when simulation objects are changed. When enabled, the simulation area and time are reset every time an object's state changes.
The Show plots checkbox enables the plot panel, including the volume and frequency plots.
The Simulation frame rate slider enables users to adjust the simulation speed. If a frame rate exceeding 60 Hz is selected, an epilepsy warning must be acknowledged and accepted before proceeding.
The Always hide gizmos checkbox permanently disables the display of gizmos within the simulation area, regardless of the simulation's state.
The fourth row displays the simulation time in milliseconds, the height/width of the simulation area in meters and the frames per second the ui is drawn in. This does not equal the simulation frame rate. If this value drops below your monitor's refresh rate, your computer hardware cannot keep up with the current simulation frame rate.
Plot Panel
The plot panel is where you can view the volume and frequency plots of the current scene. The plots are updated in real-time as you interact with the scene. It can be enabled or disabled from the quick settings using the Show plots toggle.
Volume
The volume plot panel plots microphone amplitude against simulation time in milliseconds.

By default, the plot window covers the last 6 milliseconds of simulation time.
Unchecking the Scroll volume plot checkbox allows the user to freely move inside the plot window by using:
Scrollto move verticallyShift + Scrollto move horizontallyCtrl + Scrollto zoom in and outClick & Dragto move in all directions
Microphone signals can be activated or deactivated by selecting the corresponding microphone entry in the legend located in the upper-right corner of the plot window.
The Export to SVG button prompts the user with a file dialog that enables the user to save the complete plot window, rather than just the most recent 6 milliseconds, in SVG file format.
Frequency
This feature is currently experimental and can be enabled in the preferences.
The frequency plot panel displays the intensity of the discrete Fourier transform of a microphone signal over the frequency range of 0 to 20,000 Hz.

To generate a frequency plot, one or more microphones must be selected using the FFT microphones button.
The Scaling dropdown menu allows the user to select between Normalized (linear intensities ranging from 0 to 1) or dB scaling.
Enabling the show approximation checkbox applies a moving average over the frequency plot for smoothing.
The FFT window size dropdown menu lets the user specify the number of samples used for performing the FFT.
Preferences
The preferences window provides more customization options compared to the quick settings panel.
General Settings
The general settings allow modification of the simulation as well as rendering behavior.
Simulation
The Delta L (m) slider sets the distance between pixels on a real-world scale. Smaller distances correspond to a smaller area.
The Show absorbing boundary toggle displays the absorbing boundary around the simulation area. The absorbing boundary is used for more accurate free field simulations. The absorbing boundary width is modified with the Boundary width (px) slider. Greater values correspond to better free field simulations (the free field works best for wavelengths shorter than the boundary width).
Rendering
The Colormap drop-down list allows the selection of multiple different gradients for rendering. The most common scientific gradients are represented.
The Min Gradient and Max Gradient values set the minimum and maximum pressure values. Greater and smaller values are clipped at the gradient's edges.
Experimental Settings
Experimental settings offer toggles for experimental features, which are disabled / hidden by default. These features might be incomplete, broken or subject to change in the future.
The Frequency analyzer toggle enables the use of the frequency plot. There is a known bug in the analysis of white noise or Gaussian sources post-diffraction, characterized by the emergence of unexplainable high-frequency components.
The Mic values export toggle adds an Export CSV button to each microphone entry in the outline panel. This button exports all recorded pressure values into a .csv file. The export is done in the background and the file is saved in the current working directory.
The Wave files toggle loads a .wav file and sets the delta l value to the corresponding sample rate. Each source now supports the Wave file waveform. Selecting this waveform type makes the source use the loaded wave file as an input. The simulation time controls the playback time of the audio file. A new Export wav button is also added to each microphone entry in the outline panel. This button exports all recorded pressure values into a wave file.
About
The About page is a simple window that displays some information about the application. It is accessible from the Help menu. You can also find the current version of the application here.
Shortcuts
Any of the following keybinds can also be found in the keybinds window:
File actions
| Action | Keybind |
|---|---|
| Create new simulation | Ctrl + N |
| Save current simulation | Ctrl + S |
| Open previous simulation | Ctrl + O |
| Quit simulation | Ctrl + Q |
General
| Action | Keybind |
|---|---|
| Undo | Ctrl + Z |
| Redo | Ctrl + Shift + Z |
| Copy selected | Ctrl + C |
| Paste clipboard | Ctrl + V |
Simulation
| Action | Keybind |
|---|---|
| Play/Pause | Space |
Tools
| Action | Keybind |
|---|---|
| Delete selected | Backspace or Delete |
| Snap to grid | Ctrl + Move or resize wall |
| Select tool | Q |
| Move tool | W |
| Resize tool | E |
| Place rectangular wall tool | R |
| Place circular wall tool | C |
| Place source tool | S |
| Place microphone tool | M |
Select
The select tool  allows the user to select walls, sources and microphones by clicking on the circular gizmo displayed at the object's center point.
When the gizmo is clicked using the select tool, the object is selected, allowing it to be deleted by pressing the Backspace or Delete key. Additionally, the object's entry in the outline will unfold.
The move tool can be activated either by clicking the corresponding icon in the toolbar or by pressing Q.
Place
The place tool  allows the user to add walls, sources and microphones to the simulation by clicking inside the simulation area.
When an object is placed, it is not automatically selected.
The place tool can be activated by clicking the corresponding icon in the toolbar.
The different simulation objects are selected in the tool options panel or by pressing:
Rfor rectangular wallsCfor circular wallsSfor sourcesMfor microphones
The default object is the source.
Move
The move tool  allows the user to move walls, sources and microphones by clicking and dragging the circular gizmo displayed at the object's center point.
When the gizmo is clicked using the move tool, the object is selected, allowing it to be deleted by pressing the Backspace or Delete key. Additionally, the object's entry in the outline will unfold.
The move tool can be activated either by clicking the corresponding icon in the toolbar or by pressing W.
While moving an object, its position can be snapped to the nearest multiple of ten by holding down the Ctrl key.
Resize
The resize tool  allows the user to resize walls by clicking and dragging the circular gizmo displayed at the wall's edges.
When the gizmo is clicked using the resize tool, the object is not automatically selected.
The resize tool can be activated either by clicking the corresponding icon in the toolbar or by pressing E.
While resizing a rectangular wall, the edge position can be snapped to the nearest multiple of ten by holding down the Ctrl key.
Source
Sources are the only sound emitters available in wavefront. They emit sound in all 4 directions (top, left, right, bottom) and can be placed anywhere in the render area. Each source can be assigned a number of properties, such as frequency, amplitude and phase, depending on the waveforms used.
The following waveforms are available for sources:
Sine
The sine waveform is a simple waveform that oscillates in the range of \([-a, a]\) (where \(a\) is the amplitude). It is the most basic waveform and is used to represent a pure tone. The following parameters can be set for the sine waveform:
- Frequency: The frequency of the sine wave in Hz.
- Amplitude: The amplitude of the sine wave (unitless).
- Phase: The phase of the sine wave in degrees.
Gaussian
The Gaussian waveform is a periodic bell-curve that is used to represent a short impulse. The following parameters can be set for the Gaussian waveform:
- Frequency: The frequency of the curve in Hz.
- Amplitude: The amplitude of the curve (unitless).
- Phase: The phase of the curve in degrees.
- Standard Deviation: The standard deviation (width) of the Gaussian curve.
White Noise
The white noise outputs random noise at all frequencies. The following parameters can be set for the white noise waveform:
- Amplitude: The amplitude of the noise (unitless).
Microphone
Microphones are used to inspect the sound field (and its pressure) at a specific point in the render area. They can be placed anywhere inside it.
The output of a microphone is a time series of the sound pressure at its location. To visualize this as a plot or perform a Fourier transform, you can use the Volume or Frequency plots respectively.
Walls
Walls can be placed in the simulation area. In this version of wavefront there are two primitive types of walls: rectangles and circles. Walls can be placed using the place tool.
All wall types have the following properties:
- Reflection factor (0-1): The reflection factor determines how much of the wave is reflected when it hits the wall. A reflection factor of 0 means that the wave is absorbed completely, while a reflection factor of 1 means that the wave is reflected completely.
- Hollow (true/false): If a wall is hollow, wave propagation is allowed inside the wall. This can be useful for creating complex waveguides or rooms.
Rectangle Walls
Rectangular walls are defined by two points: the top-left and bottom-right corners of the rectangle. The reflection factor and hollow properties are applied to the entire rectangle.
Circle Walls
Circular walls are defined by a center point and a radius. The reflection factor and hollow properties are applied to the entire circle.
For hollow circular walls, an Opening angle can be defined. This angle determines the opening of the circle in degrees. The opening angle is measured from the center of the circle to the left and right sides of the opening. This opening can be shifted by defining an offset angle called Rotation angle.
